


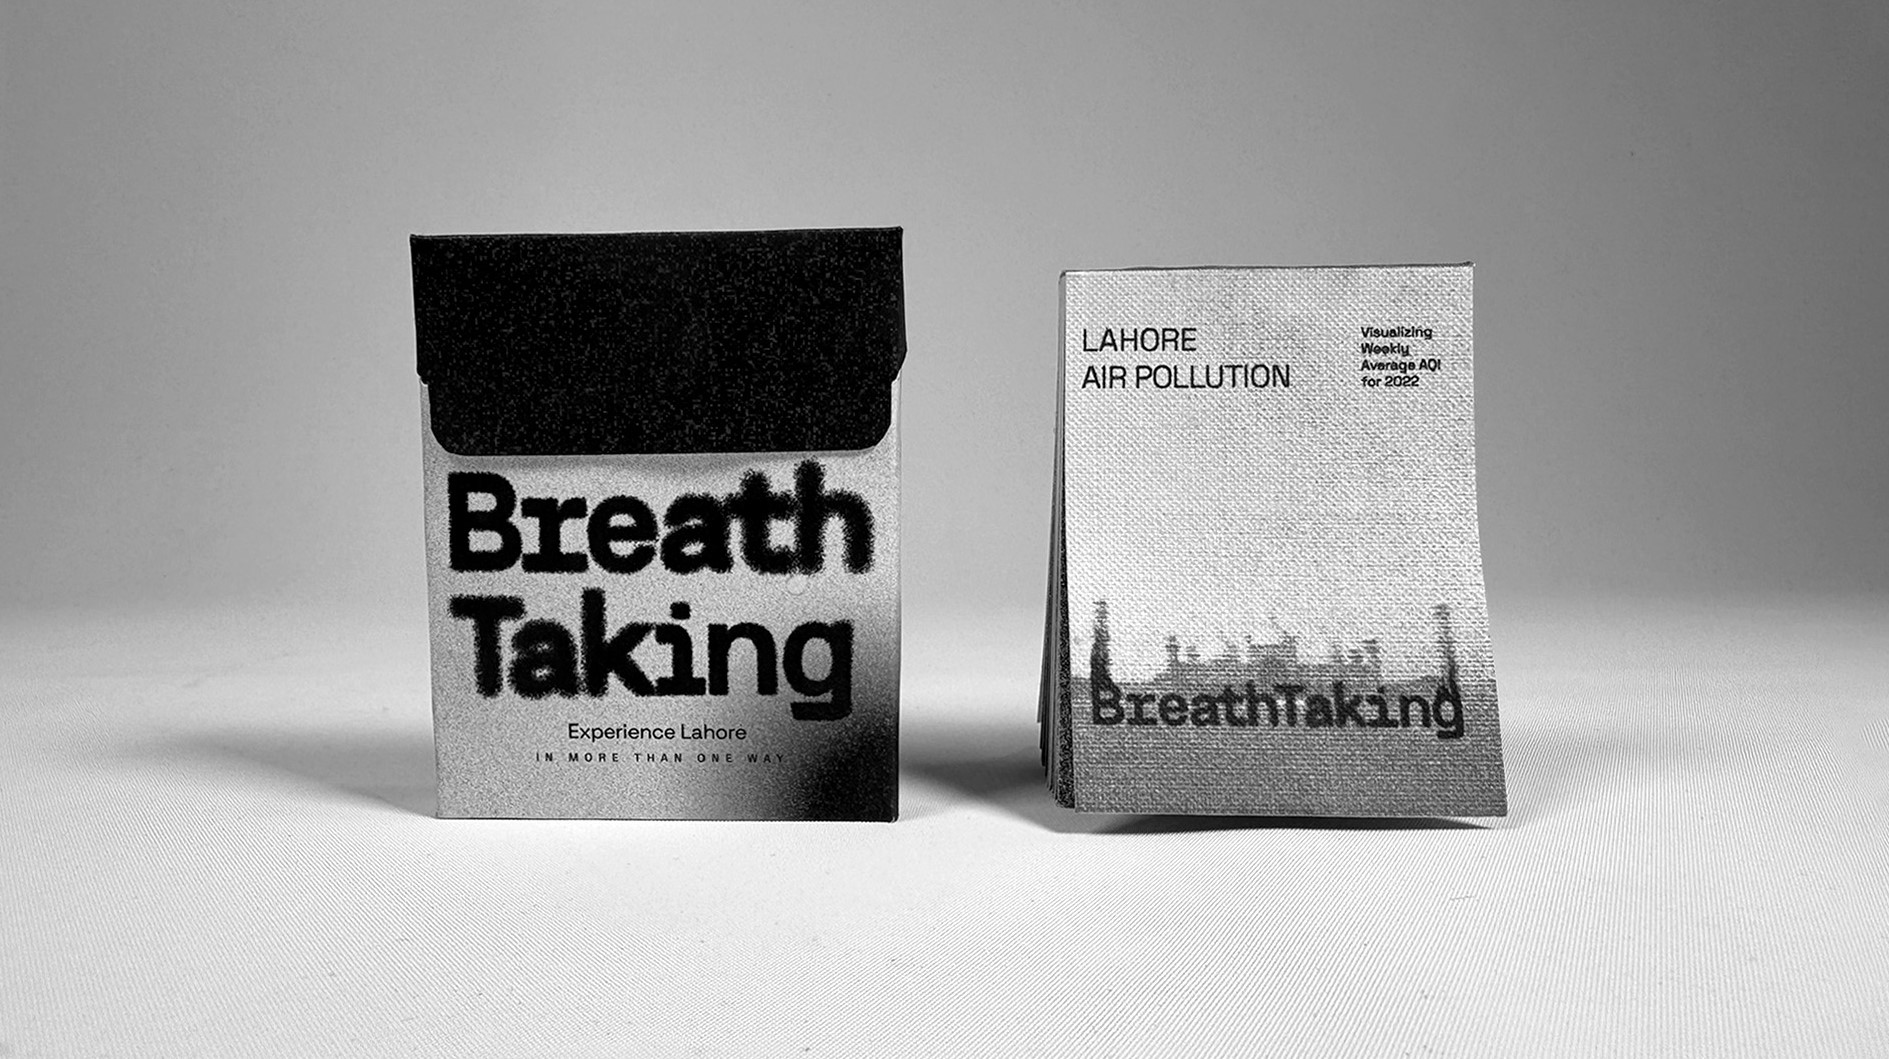
Breathtaking is a unique approach to data visualisation showing the air quality of “breathtaking Lahore” during the year 2022.
Design Brief: Choose three data sets and inform the audience with the data using appropriate media for the appropriate target audience.
Target Audience: People in Lahore
Intention: To inform people about climate crisis in Lahore which has been ranked as one of the most polluted cities in the world. The air pollution in Lahore feels as if someone is taking your right to breathe. You can see and feel it in your throat.
Logo Design: The idea came from secondary research where someone described living in Lahore as if someone is taking your basic right to breathe. Lahore being a cultural capital of Pakistan has been presented as a “breath-taking city” to inform the audience and authorities to take action against the climate crisis.
Media Choice: I used cigarette packaging as a cover for my flipbook because breathing in Lahore is as dangerous for your lungs as smoking.
Choice of second media: Instead of showing numbers and graphs of air quality, I wanted to humanize the data. My approach was to target the audience’s sight. So, I came up with the idea of using a flipbook to show a progression of weekly air quality for 2022.
Humans don’t understand numbers, we understand visuals.
Data set: For each weekly AQI, I used a single picture of the famous monument in Lahore, Badshahi Mosque, and showed how bad air quality is creating haziness, blurriness, and particulate matter.
Insights: During winters starting from Oct and continuing till March, the air quality is highly dangerous and the visibility of the image is bad.
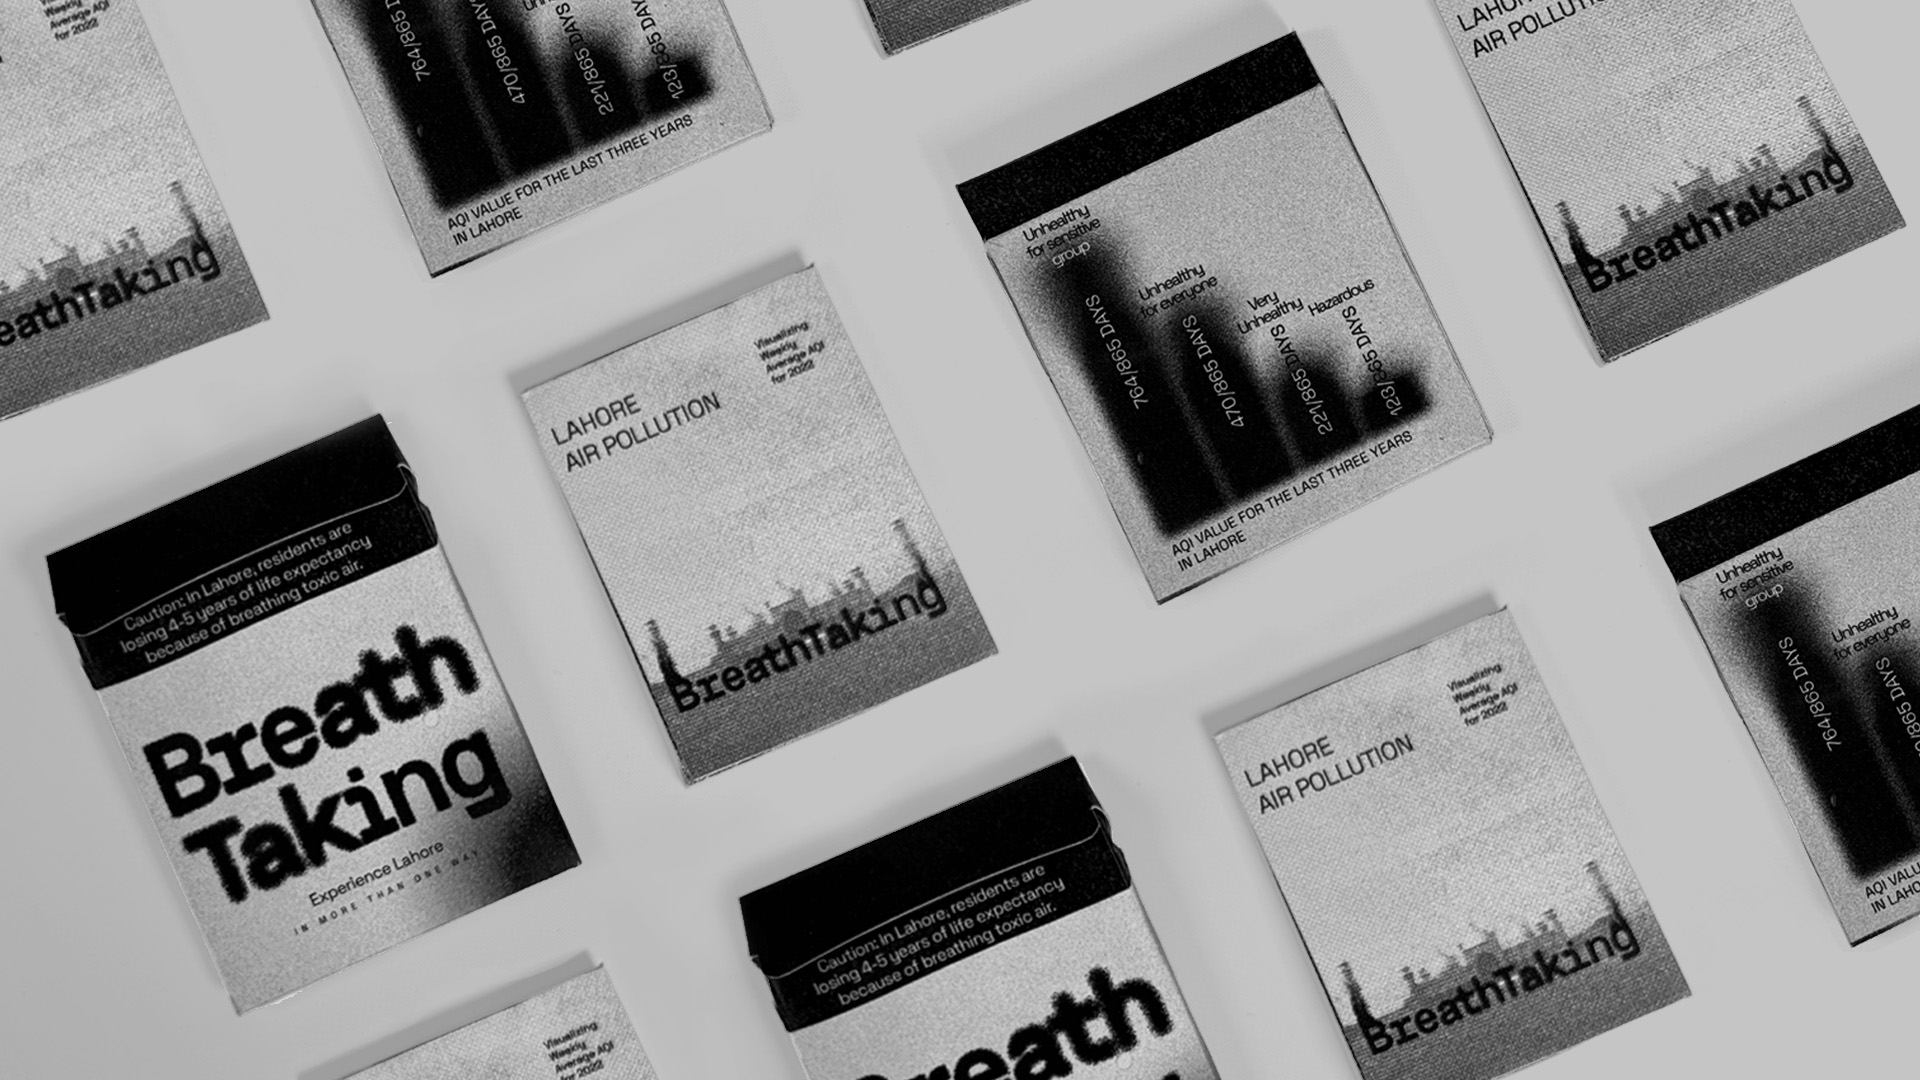
Data Set 1: My first data set talks about the reduction in average life expectancy of 4-5 years by living in Lahore. I added that as a caution just like how cigarette packages have disclaimers.
Data Set 2: Number of days the air quality was dangerous for the residents of Lahore categorized into sensitive groups, women and children, and healthy groups.
Important Question
How many days does Lahore have healthy air quality in a year?
NONE!

CREDIT
- Agency/Creative: Muhammad Tayyab Younas
- Article Title: Breathtaking Air Quality Data Visualization for Lahore by Muhammad Tayyab Younas
- Organisation/Entity: Student
- Project Type: Graphic
- Project Status: Published
- Agency/Creative Country: United States
- Agency/Creative City: Savannah, Georgia, United States
- Market Region: Asia, Europe, Middle East, North America
- Project Deliverables: Animation, Editorial Design, Infographic, Packaging Design
- Industry: Public Utility
- Keywords: data visualization, graphic design, packaging design, climate change, climate crisis, climate emergency
-
Credits:
Graphic Designer: Muhammad Tayyab Younas